




Edition 01 ·
All four majors ended the Hyperliquid week lower. What came back, and how much?
BTC, ETH, XRP and SOL all ended the seven-day window lower on Hyperliquid. SOL had the largest weekly loss, down 20.90%, while XRP recovered 21.67% of its decline from the opening price to the low, the largest share among the four markets.
This edition measures how uneven that recovery was — and how much of the selling did not come back: by the end of the window, roughly four-fifths of each market's decline was still unrecovered. One caveat when comparing the recovered shares: XRP bottomed about two and a half hours before BTC, ETH and SOL, giving it more time to recover. We index each market to the same start, count how much of the drop came back, and then look at what funding and open interest did during the recovery window.
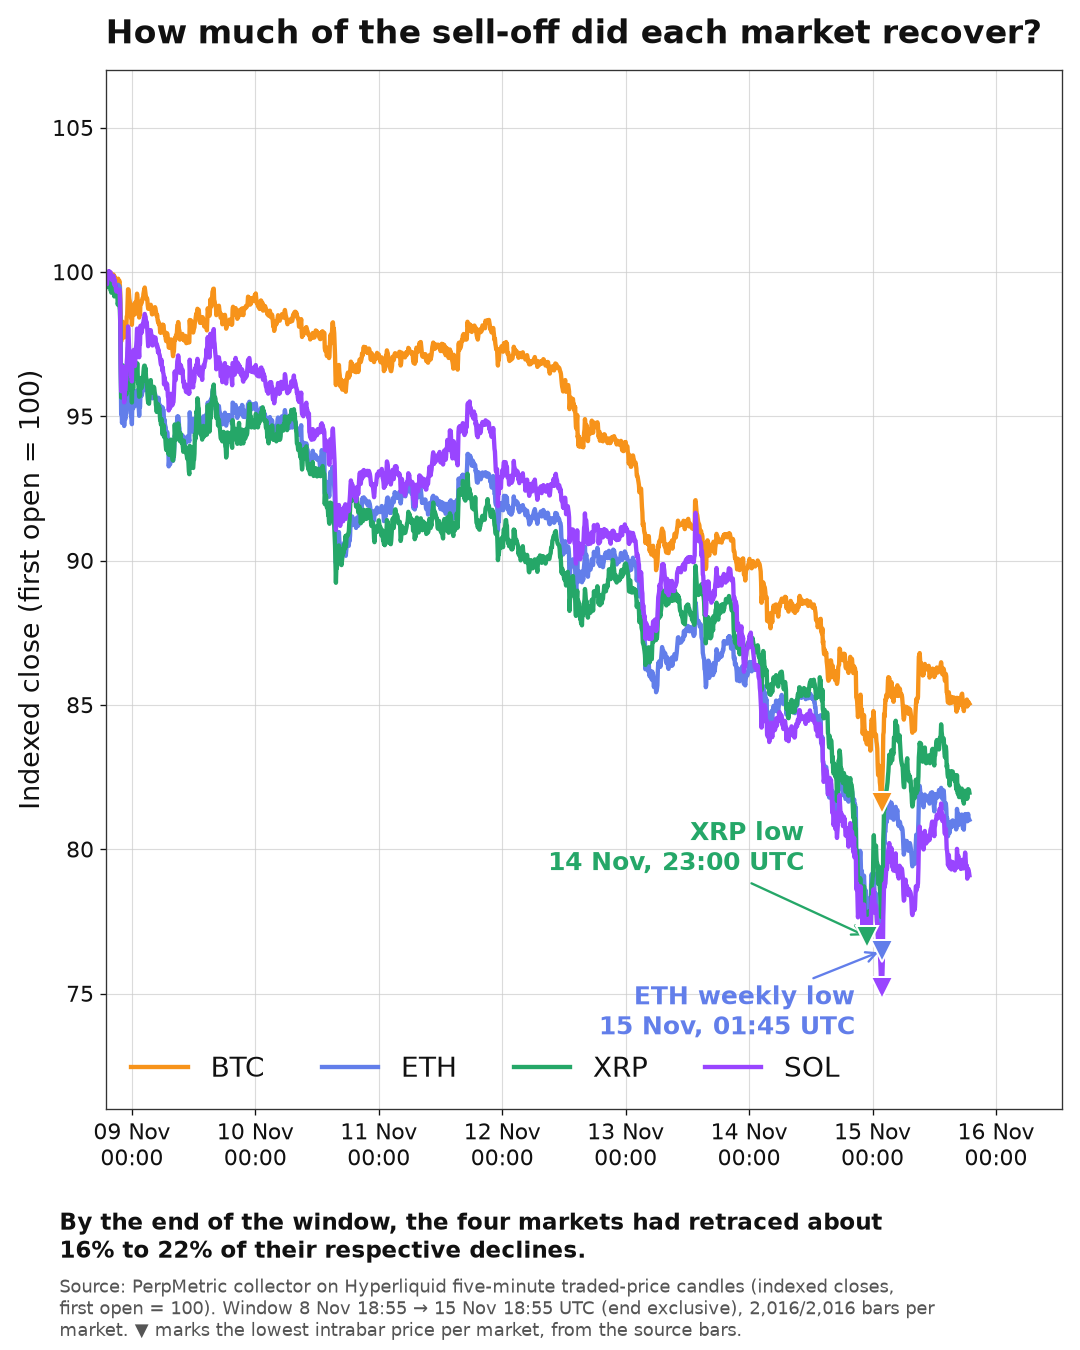
How the week resolved, per market (Hyperliquid trade candles, 5-minute bars):
| Market | Week return (first open → last close) | Drop to lowest low | Rise from low | Recovered share of the drop |
|---|---|---|---|---|
| BTC | −14.96% | −18.40% | +4.21% | 18.69% |
| ETH | −18.98% | −23.52% | +5.94% | 19.31% |
| XRP | −18.04% | −23.03% | +6.48% | 21.67% |
| SOL | −20.90% | −24.82% | +5.22% | 15.79% |
Source: PerpMetric collector, Hyperliquid five-minute traded-price candles, 8 Nov 18:55 → 15 Nov 18:55 UTC (end exclusive), 2,016 of 2,016 bars present per market. "Recovered share" = (last close − lowest low) / (first open − lowest low); "drop" is the decline from the first opening price of the window to the lowest low.
The sell-off in context: liquidations on 14 Nov
For scale on the selling that preceded the lows: MarginPad recorded $1.66 billion in liquidations on 14 November UTC across the exchanges it tracks, 94% of it long positions by value, with its busiest hour at 20:00–21:00 UTC. Our own Lighter collector received 2,622 liquidation executions totalling $14.777 million in measured notional across the four Lighter perpetuals our collector tracks (BTC, ETH, XRP and SOL) that day; that figure has known reception gaps and reflects only what our collector observed. The side indicator reflects the taker side. For the same day, MarginPad lists different event counts and notionals for Lighter; we make no attempt to reconcile that here, and we report only what our collector observed.
These numbers describe the sequence of events. They do not establish what caused what.
The bounce in its own window: Aster, 14 Nov 23:10 → 15 Nov 18:56 UTC
The Hyperliquid window above ends at 15 Nov 18:55 UTC. Our second observation set covers a shorter window on Aster: 238 snapshots per market over 19 hours 46 minutes. The Aster window began after MarginPad's busiest liquidation hour on November 14 and included the time of ETH's weekly low on Hyperliquid. Aster is read through mark prices and snapshot funding; the week comparison above uses Hyperliquid traded prices.
| Aster | Mark price change | Avg funding per 8h (snapshot mean) | Open interest, USD |
|---|---|---|---|
| BTC | +1.76% | +0.004883% | −1.95% |
| ETH | +4.04% | +0.000367% | +1.68% |
| XRP | +6.20% | −0.005663% | +3.72% |
| SOL | +2.75% | −0.009773% | −0.51% |
Source: PerpMetric collector, Aster perpetual snapshots, 14 Nov 23:10 → 15 Nov 18:56 UTC, 238 snapshots per market, collected from the public Aster market API. Funding is the arithmetic mean of snapshot funding rates over an 8-hour contract interval. Open interest is the USD value reported in the snapshot series, first snapshot vs last snapshot of the window.
One market in focus: XRP
XRP posted the largest gain in the Aster sample: it rose 6.20% while its average funding rate was negative (−0.005663% per 8 hours). Over the same window, the USD value of its open interest rose 3.72%.
SOL is the counterpart: it also rose (+2.75%) with the most negative funding in the sample (−0.009773% per 8 hours).
What we compare next
The next edition re-measures price, funding and open interest for the same four markets over the same fixed windows, so week-over-week changes are read against identical definitions rather than a moving baseline. A Premium edition with deeper order-book and trade-flow analysis is in preparation.
Method and limitations
- Hyperliquid figures use our own collector's five-minute traded-price candles; the window end is exclusive. All four series are complete (2,016/2,016 bars).
- The Aster window (19h46) is shorter than the Hyperliquid week and largely overlaps it: it opened on 14 Nov at 23:10 UTC — after MarginPad's busiest liquidation hour that day — and includes the time of ETH's weekly low on Hyperliquid, which fell in the five-minute bar opening 15 Nov at 01:45 UTC, two hours and thirty-five minutes after the Aster open. Aster figures use mark prices and snapshot funding; the week comparison uses Hyperliquid traded prices.
- Funding averages are over snapshot funding rates on an 8-hour contract interval. Aster snapshot intervals vary between four and six minutes rather than a strict five.
- Open interest in the Aster table is the USD value from the snapshot series (first vs last snapshot of the window). A native-unit open-interest figure was prepared for this edition but could not be reproduced from the collected snapshot series within the audit's tolerance, so it is left out.
- External figures (MarginPad) come from a third-party tracker with its own coverage; we cite them as reported, with their own date and scope.
- PerpMetric Research is observational. Nothing here is investment advice.
© PerpMetric Research, 16 November 2026. Data collected by the PerpMetric collectors; external sources attributed inline.